Miyajima weather by month: average temperature and rainfall
Average monthly high and low temperatures, rainfall and the wettest months in Miyajima, from Japan Meteorological Agency climate normals, to help you choose when to go and what to pack.
When it rains most
- Rainy season (tsuyu), normal dates
- around June 6 – around July 19Average onset and end published by the Japan Meteorological Agency for 1991–2020; actual dates vary each year. Sources
- Wettest months on average
- May, Jun, and JulThe three months with the highest normal rainfall at this station.
| Month | Avg high (°C) | Avg low (°C) | Rainfall (mm) |
|---|---|---|---|
| Jan | 9.9 | 2.0 | 46.2 |
| Feb | 10.9 | 2.4 | 64.0 |
| Mar | 14.5 | 5.1 | 118.3 |
| Apr | 19.8 | 10.1 | 141.0 |
| May | 24.4 | 15.1 | 169.8 |
| Jun | 27.2 | 19.8 | 226.5 |
| Jul | 30.9 | 24.1 | 279.8 |
| Aug | 32.8 | 25.1 | 131.4 |
| Sep | 29.1 | 21.1 | 162.7 |
| Oct | 23.7 | 14.9 | 109.2 |
| Nov | 17.7 | 8.9 | 69.3 |
| Dec | 12.1 | 4.0 | 54.0 |
Station Hiroshima · Japan Meteorological Agency · normals 1991–2020 · Sources
Miyajima travel guides
Monthly weather by city
Photo credits1
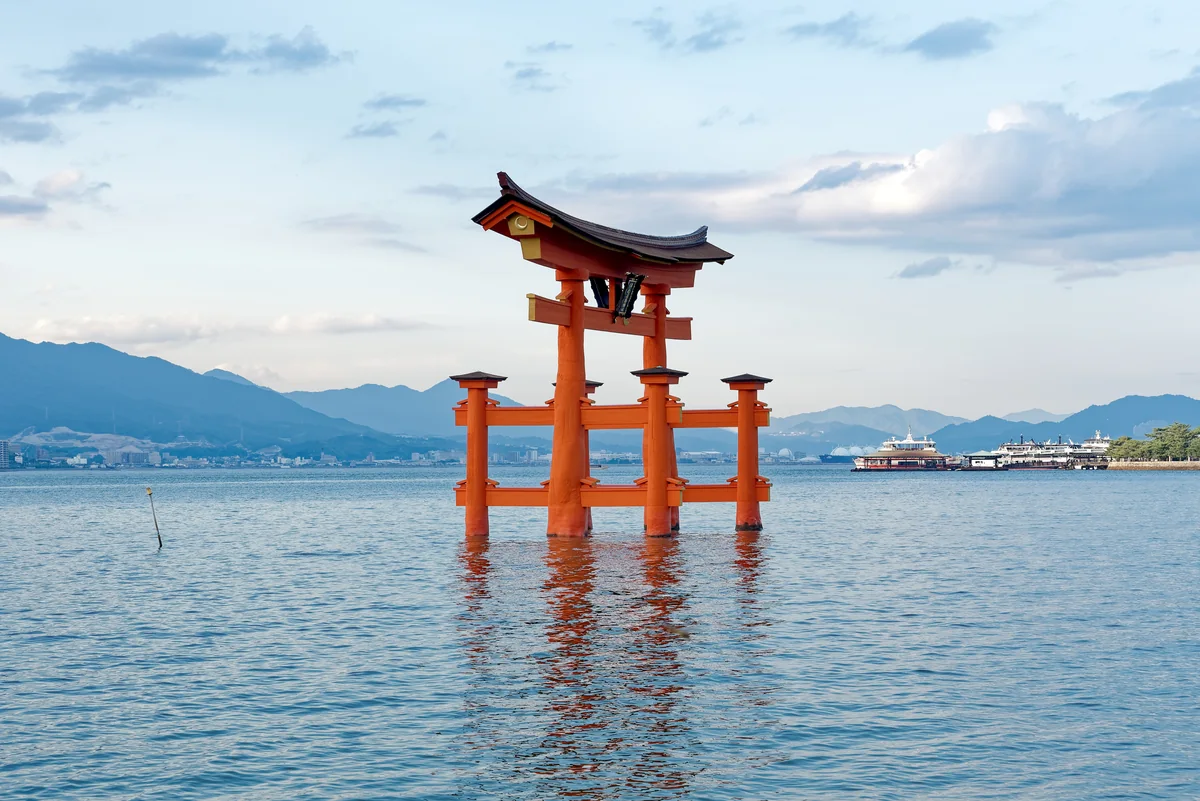
- The Great Torii of Itsukushima Shrine surrounded by sea water, with a boat in the distance
- Jakub Hałun · CC BY-SA 4.0
